Search "Milledgeville home price" today and you will get three different answers from three different sites, and none of them will agree with each other by a small margin. One site puts the average home value at $237,180. Another reports a median sale price of $349,967 for the most recent 30 days. A third lists the median home value at $193,100 without ever saying what month that number reflects.
That is not a typo, and it is not three sites disagreeing about the same math. It is three sites correctly measuring three different things in a market small enough that the measuring itself becomes part of the story. If you are comparing Milledgeville to other Middle Georgia towns before you make a move, the number you land on says less about the city than about which handful of homes happened to close during the window that site chose to look at.
Three Sites, Three Answers, Same City
Here is what each source was actually reporting, side by side:
| Source | Figure | Window | What it's actually measuring |
|---|---|---|---|
| Zillow's home value index | $237,180 average, up 1.4% year over year | Through June 2026 | An estimated value across all homes, not just ones that sold |
| Orchard | $349,967 median sale price, up 22.8% year over year | Trailing 30 days, 32 homes sold | Actual closed sales |
| Niche | $193,100 median home value | No window given | An estimated value, undated |
Notice the spread. The lowest figure and the highest figure are over $150,000 apart, describing the same city in roughly the same stretch of time. That gap is the tell. When sources this far apart are all technically correct, the problem is not the math. It is the sample each one happened to catch.
The Real Reason the Number Moves So Much
This isn't a new wrinkle for Milledgeville. Back in spring 2025, Redfin's own tracker showed just 11 home sales citywide in a single month. Thin monthly volume isn't a one-time blip here, it's a structural feature of a small market, and it is still true now. Orchard's most recent 30-day window caught only 32 closings, down from 45 in the comparable period a year earlier.
In a market where hundreds of homes change hands every month, a handful of unusually priced sales get absorbed into the average and barely move it. In a market moving between roughly a dozen and three dozen sales a month, they don't get absorbed. They are the average.
One well-appointed Lake Sinclair-adjacent sale in the $500,000s, or a small cluster of them landing in the same 30-day window, can pull a median up by tens of thousands of dollars almost by itself. A run of smaller downtown or in-town sales can pull it right back down the next window. Neither number is wrong. Both are just small enough samples that whatever happened to close becomes the headline, whether or not it represents what is actually happening across the rest of the city.
This is also why a year-over-year comparison like Orchard's 22.8% jump can be misleading on its own. It doesn't necessarily mean prices are climbing that fast. It can just mean this year's 30-day sample caught a different mix of properties than last year's did.
Two Housing Markets Wearing One ZIP Code
The deeper reason Milledgeville's numbers scatter this much is that the city is not really one housing market. It is two, reported as one.
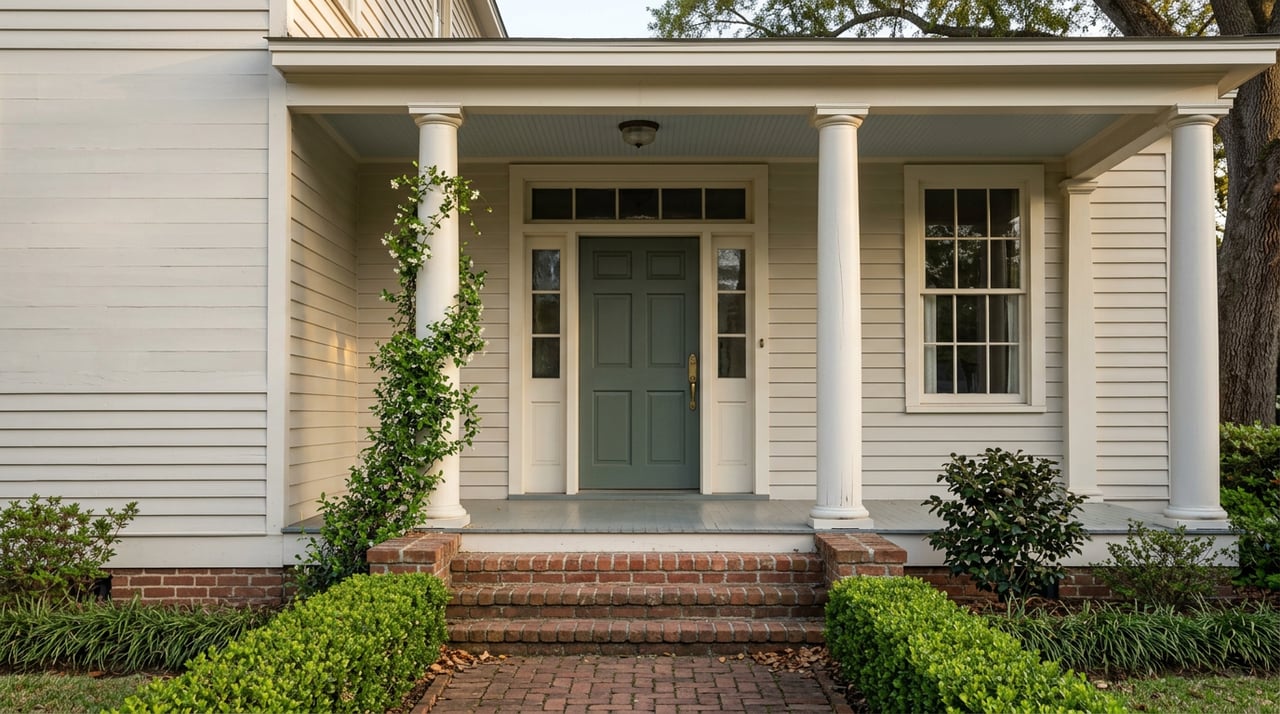
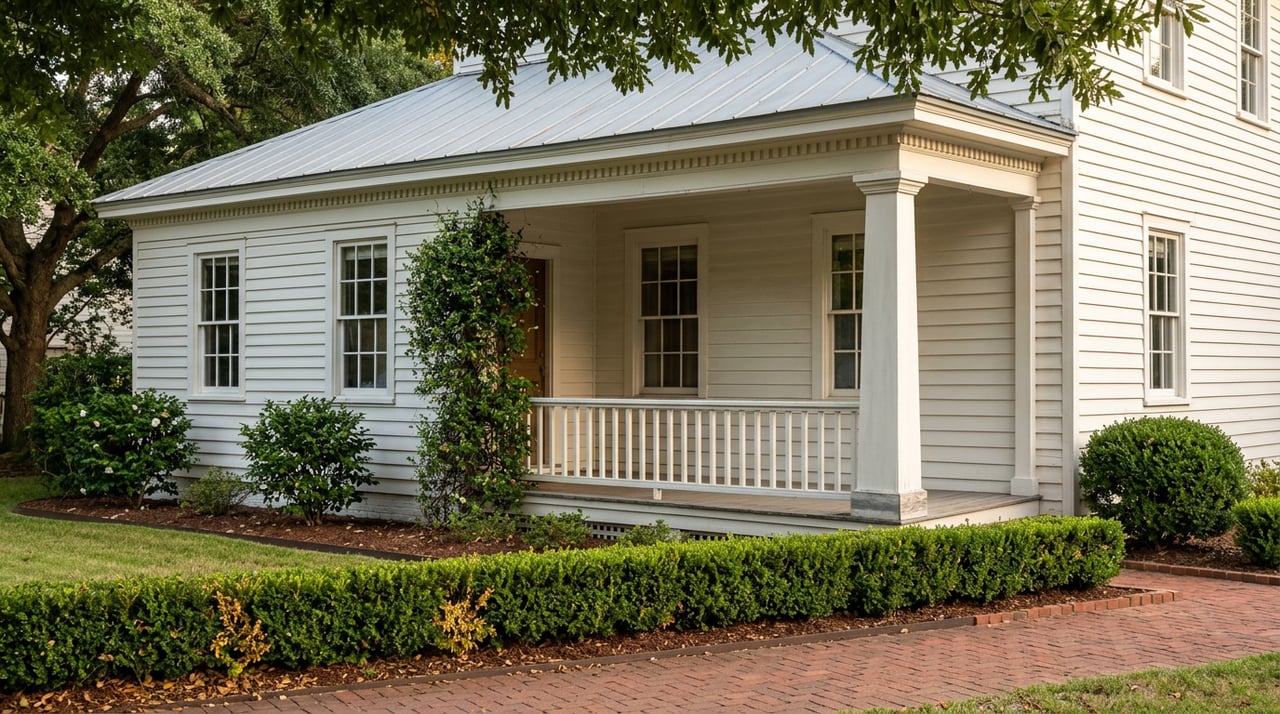
On one end, you have the historic in-town stock: smaller, older homes close to downtown, including the pocket known locally as the Historic West End, within walking distance of Georgia College & State University and Georgia Military College. Georgia College, Georgia Military College, and the local healthcare sector anchor a steady stream of faculty, staff, and rental-minded buyers looking for smaller, less expensive homes near campus and downtown. Redfin's own listing search currently shows 24 vintage homes for sale in Milledgeville with a median list price of $215,000, a figure that sits nowhere near the $349,967 closed-sale median Orchard reported for its 30-day window.
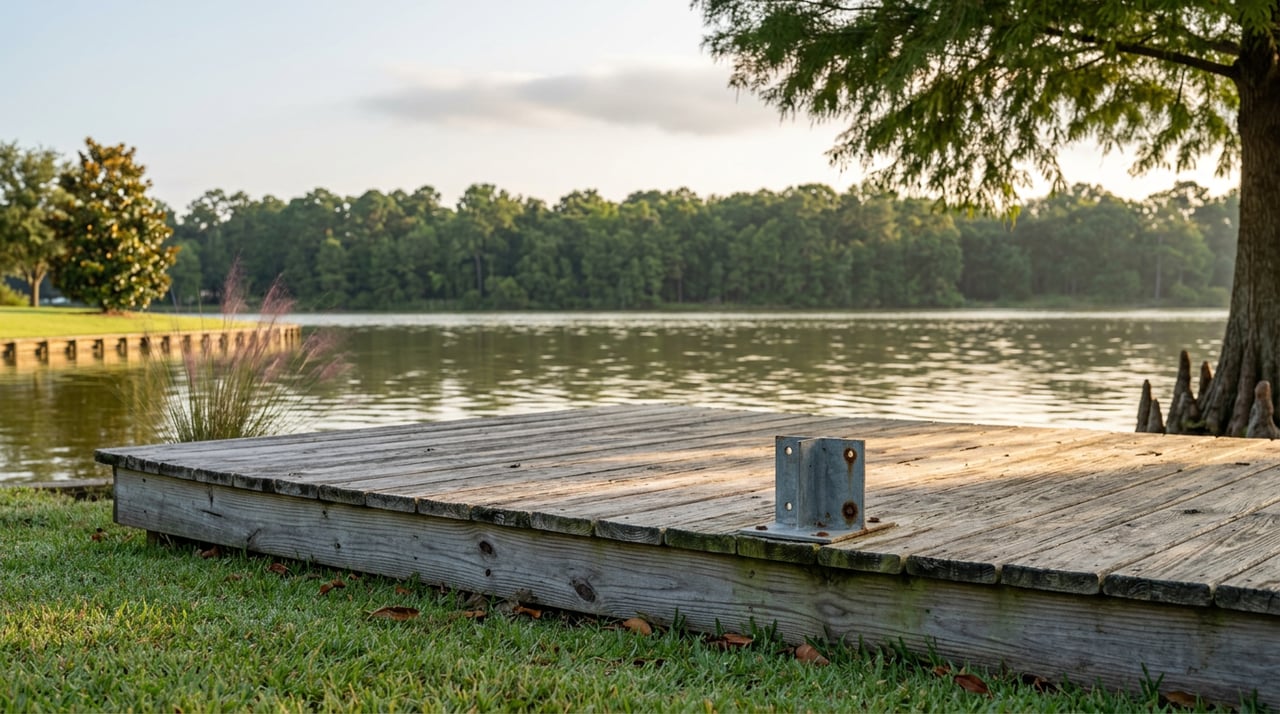
On the other end, you have Lake Sinclair-adjacent and acreage properties that still fall inside Milledgeville's reporting boundary even though they are a completely different product: larger lots, water access, docks, more square footage, and a price per square foot that has little in common with a downtown bungalow. When enough of those close in the same 30-day stretch, they pull the citywide median toward the high end almost by themselves.
When more of one type closes in a given month, the number leans that direction. That is the entire mechanism behind the wild swings you saw in the table above.
What This Means When You Write an Offer
If you are actively comparing Milledgeville to somewhere else, or trying to figure out what your money buys here, the citywide median is close to useless on its own. What matters is the median for your segment.
If you are looking at a three-bedroom historic home near downtown, your real comps are other recent in-town sales, not the Lake Sinclair estate that dragged last month's headline number up. If you are looking at acreage or water access, the reverse is true, and the downtown starter-home sales that pulled the median down don't tell you much about what you'll pay.
There is also a negotiating signal buried in the aggregate data that is worth knowing regardless of segment. Orchard's tracking showed homes sitting on the market for a median of 46 days recently, up from 25.4 days a year earlier, and 43.75% of active listings had already dropped their price, up sharply from the year before. The share of homes selling above list price fell to just over 6%. Read together, that points to a market with more room to negotiate than it had a year ago, though how much room depends heavily on whether you are shopping the in-town segment or the lake-adjacent one, since scarcity behaves differently in each.
The practical move is to stop asking what Milledgeville homes cost and start asking what homes like the one you want cost, based on closings in the last few weeks, not an index averaged across a city that is really two markets wearing one name.
A Few Quick Answers
Which number should I actually trust? None of them by itself. Each is measuring something real, just a different slice. The useful number is the recent closed-sale median for your specific type of home and area, not the citywide figure any single site publishes.
Why did the median jump so much between two recent reports? Because so few homes close in Milledgeville in any given month, a single unusually priced sale, or a cluster of them, can swing the citywide number by tens of thousands of dollars without reflecting a real shift in what typical homes are worth.
If you are trying to figure out what a specific street, or a specific type of home, is actually worth in Milledgeville right now, the aggregator math will only get you so far. Carla Bentley can pull the recent closed comps that actually match what you're shopping for, whether that's a historic home near downtown or something closer to Lake Sinclair, and tell you what buyers in that segment are really paying. Let's Connect.